Editor’s Note: This article was originally published in 2013. The graphs shown are from an earlier version of AcuGraph; the current version is AcuGraph CS. The graph analysis techniques and clinical reasoning demonstrated here remain fully applicable.
Once you have used AcuGraph for a while, your graph analyzing skills become quite refined. Graphs begin to come alive and tell you a story of what is happening within your patient. Often, you begin to form a hypothesis before the patient even reveals their chief complaint.
Who wants to practice graph analysis?
I have two graph reports to share with you–from two different patients.
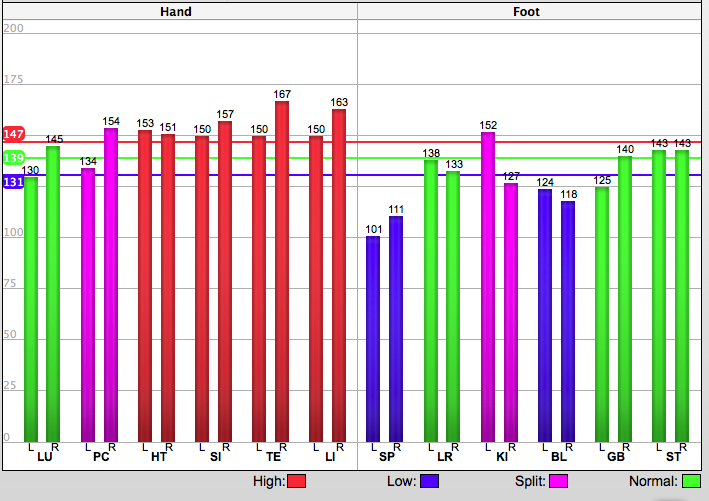
Patient #1:

Patient #2:

Tell me what you see when you analyze these two graphs.
- Are there similarities between the two graphs?
- Are there differences between them?
- What types of questions would you ask your patient if they presented with either of these graphs?
- What working diagnosis are you forming in your mind when you see these graphs?
- What common points would you use to treat both of these patients?
- What different points might you consider adding for Graph #1 or Graph #2 based on the differences between the graphs?
- Are there any emotional components you would want to ask your patient about?
- Are there any dietary factors you would want to ask your patient about?
- If you have a TCM background, what TCM diagnosis might you begin to hypothesize?
The Analysis
Take a moment to study the graphs above and consider the questions before reading on. When you’re ready, here’s a detailed analysis of both patients.
Patient #1
Patient #2:
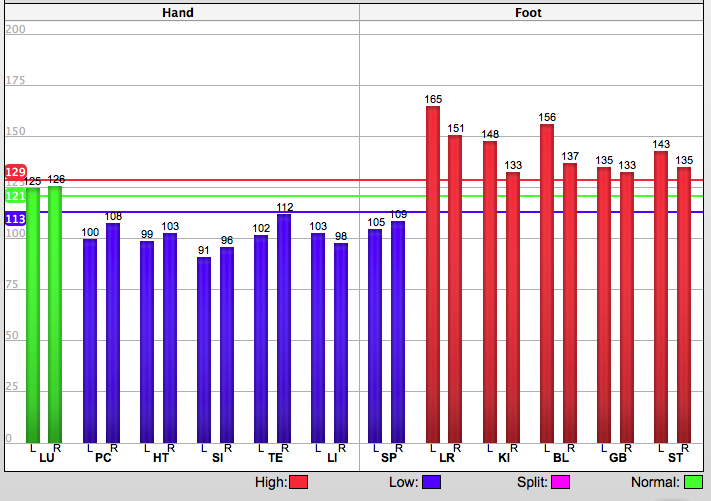
You’ll notice that both of these graphs show an upper/lower body imbalance. Graph #1 has a larger concentration of energy in the upper body, and in graph #2 the energy is focused more in the lower body.
Questions
Even without the patient telling me their chief complaint–my mind immediately begins formulating questions.
Graph #1:
- Are you experiencing any neck and/or shoulder tension?
- How have your emotions been? Have you been suffering with anxiety?
Graph #2:
- Are you experiencing low back pain? Headaches–frontal, temporal, occipital, vertex?
- Are you having any bloating? How about swelling/edema in the lower body?
- Female: Tell me about your menstrual cycle? Do you experience PMS, cramping or clots? Are you having any problems with vaginal discharge?
- Male: Do you have an enlarged prostate?
Commonalities
Both patients have spleen deficiency. If energy isn’t flowing smoothly through the middle jiao, it would make sense that the Spleen cannot perform its job of transporting and transforming food into energy efficiently.
My immediate goal would be to treat the Dai Mai and the Spleen. Once these imbalances are resolved, I would expect the patient to present with a completely different diagnosis on the next visit.
Points that I would choose are as follows:
- Dai Mai: TE 5, GB 41
- Spleen: CV 12; SP 6, ST 36
Treatment Approaches
Extra points that I would consider using–beyond the points listed above might include the following.
Graph #1:
- CV 17
- HT 7
- Neck and/or shoulder treatment
Graph #2:
- LR 6: This is the Xi Cleft for the channel. I have found that creating swift movement up the Liver channel helps energy disperse from the lower body up.
- Back shu treatment: This will affect all the channels that are out of balance and create nice movement in the bladder channel in general.
TCM
Can you begin to formulate any TCM patterns by looking at the graph? Of course you’ll need to use additional diagnostic skills beyond AcuGraph to come up with a full TCM pattern diagnosis, but do you get any clues of what you might find just by looking at the graph. Here are a few thoughts that come to my mind:
Graph #1:
- Heart Fire
- Spleen Qi Deficiency
- Fire not promoting Earth
Graph #2:
- Liver Yang Rising
- Stomach Fire
- Spleen Qi Deficiency
- Liver overacting on Earth
Chief Complaint
I didn’t tell you these patients’ chief complaints before we began picking the graph apart for a couple of reasons. First, I wanted you to realize that, with a little practice, you can gain a lot of information simply by analyzing the graph. Second, often I graph the patient before I ask the chief complaint, just so that I can “guess” what is going on in their body based on my graph findings.
Patient #1: This patient had just lost her mother to cancer. Obviously, she was going through a lot of emotional turmoil. Her body was experiencing the residuals of emotional trauma. Her heart channel was full–emotionally and energetically.
Patient #2: Her chief complaint was bilateral low back pain. She also has chronic digestion problems, including a lot of gas and bloating. Her diet is poor, and she drinks of a lot of ICE water and diet soda.
We hope you enjoyed this graph analysis exercise. The key takeaway: with practice, you can gain tremendous clinical insight simply by analyzing the graph — often before the patient reveals their chief complaint.

Kimberly Thompson, L.Ac.
Acupuncture Research Analyst
not that familiar with theorists used on graph, just that #2 graph looks total stressed in liver, gall bladder stomach area. where heart pericardium low. excess pattern in liver gallbladder and stomach?
interested in hearing the results.
Wish to hear your reply.
Chris
Graph 2 reminds me of a belt block. Graph 1 is kind of similar maybe just shown without normalization? But the meridians that are high all have to deal with digestion, respiration, and cardiovascular. Hope my 2 cents helps
Both are Belt block syndrome, but upper graph shows high in upper extremity part, lower graph shows in lower in lower extremity, even though both graph spleen deficiency exist, neck and back pain and general fatique and mental stress is obvious in both graph. The point we select both the graph is G.B41, T.E 5, and spleen deficiency point, take care of the yin in both graph according to deficiency and excess.
we have here Lu and SP in 2 grapg same,
we have a problem in the middle (maybe belt block),
i will ask for emotion and trayma in the middle on the body and maybe in spain, yes i will ask for if have digestion problems and for what food is eat the last months, in the first i will start with GB 41 , SP 21 , TE 5 and i will see soon,
in second i will start with GB 41 , TE 5 and i wiil see after (st 26 ….)
these graphs do not similar because in Patient #1 hand has many high and foot do not have high and also patient #2 hand do not have any high and foot have high.
so there are lot of different in these two.that’s all.
It looks like there is a belt block in both graphs….one is blocked above, second blocked below., I would ask patient one if they had trouble sleeping, any trouble with their shoulders, constipation. Patien 2 I would ask if they have been angry/irritable, low energy, headaches
I would ask both of them about pain. The first one upper body, shoulder, neck and headaches. Want to know about their sleep and if the person has anxiety & stress. 2nd chart, pain in the lower body: low back, sciatic. Would ask about energy level and sleep. Very deficient and may have depression. Wondering about genitourinary lot of excess so could have menstrual problems if female, frequently urination maybe with heat, possible constipation or diarrhea. Like the belt block idea as both have excess energy in either the upper or lower part of body.
I do not see graph 1 or graph 2 from safari. Please help
Hi Mark, this should be fixed now. Please let us know if you still do not see the images! Thanks!