Editor’s Note: This post references AcuGraph 5, which has been succeeded by AcuGraph CS. The clinical concepts discussed remain applicable to current practice.
In this tutorial we’re going to talk about graphs and all the graph styles that are included in AcuGraph 5, how to interpret them, and what they mean. Select a patient, and go to Last Graph. This pulls up the last exam that you performed on that patient. Now in it’s simplest sense everything is color-coded. Green meridians are normal and within the normal range and that normal range is considered between the blue horizontal line, and the red horizontal lines, with the mean is represented by green line. Anything that falls in that range is considered normal and is colored green. Above the range is excessive and below the range is deficient. The purple color represents a “split meridian” which is a significant imbalance between the left and right side of the same channel.
 Most of the graphs follow the same pattern, showing the same graph results in different ways.
Above is the Baseline graph. This is the go-to graph and it’s just a nice and easy way to look information.
If you click on Yin/Yang then you’ll have the Yin meridians over the left and Yang on the right. This is good for focusing on just the Yin channels, or for detecting patterns in Yin vs. Yang channels.
Most of the graphs follow the same pattern, showing the same graph results in different ways.
Above is the Baseline graph. This is the go-to graph and it’s just a nice and easy way to look information.
If you click on Yin/Yang then you’ll have the Yin meridians over the left and Yang on the right. This is good for focusing on just the Yin channels, or for detecting patterns in Yin vs. Yang channels.
 Next is the By Element. This graph puts the meridian into its element pairs. Sometimes you will see two meridians in the same element that are both imbalanced. This suggests that the element itself likely has some issues and should be considered for element-based treatment. On this graph you’ll notice that there are darker shadings behind the graph bars. This shading represents the average score for the entire element.
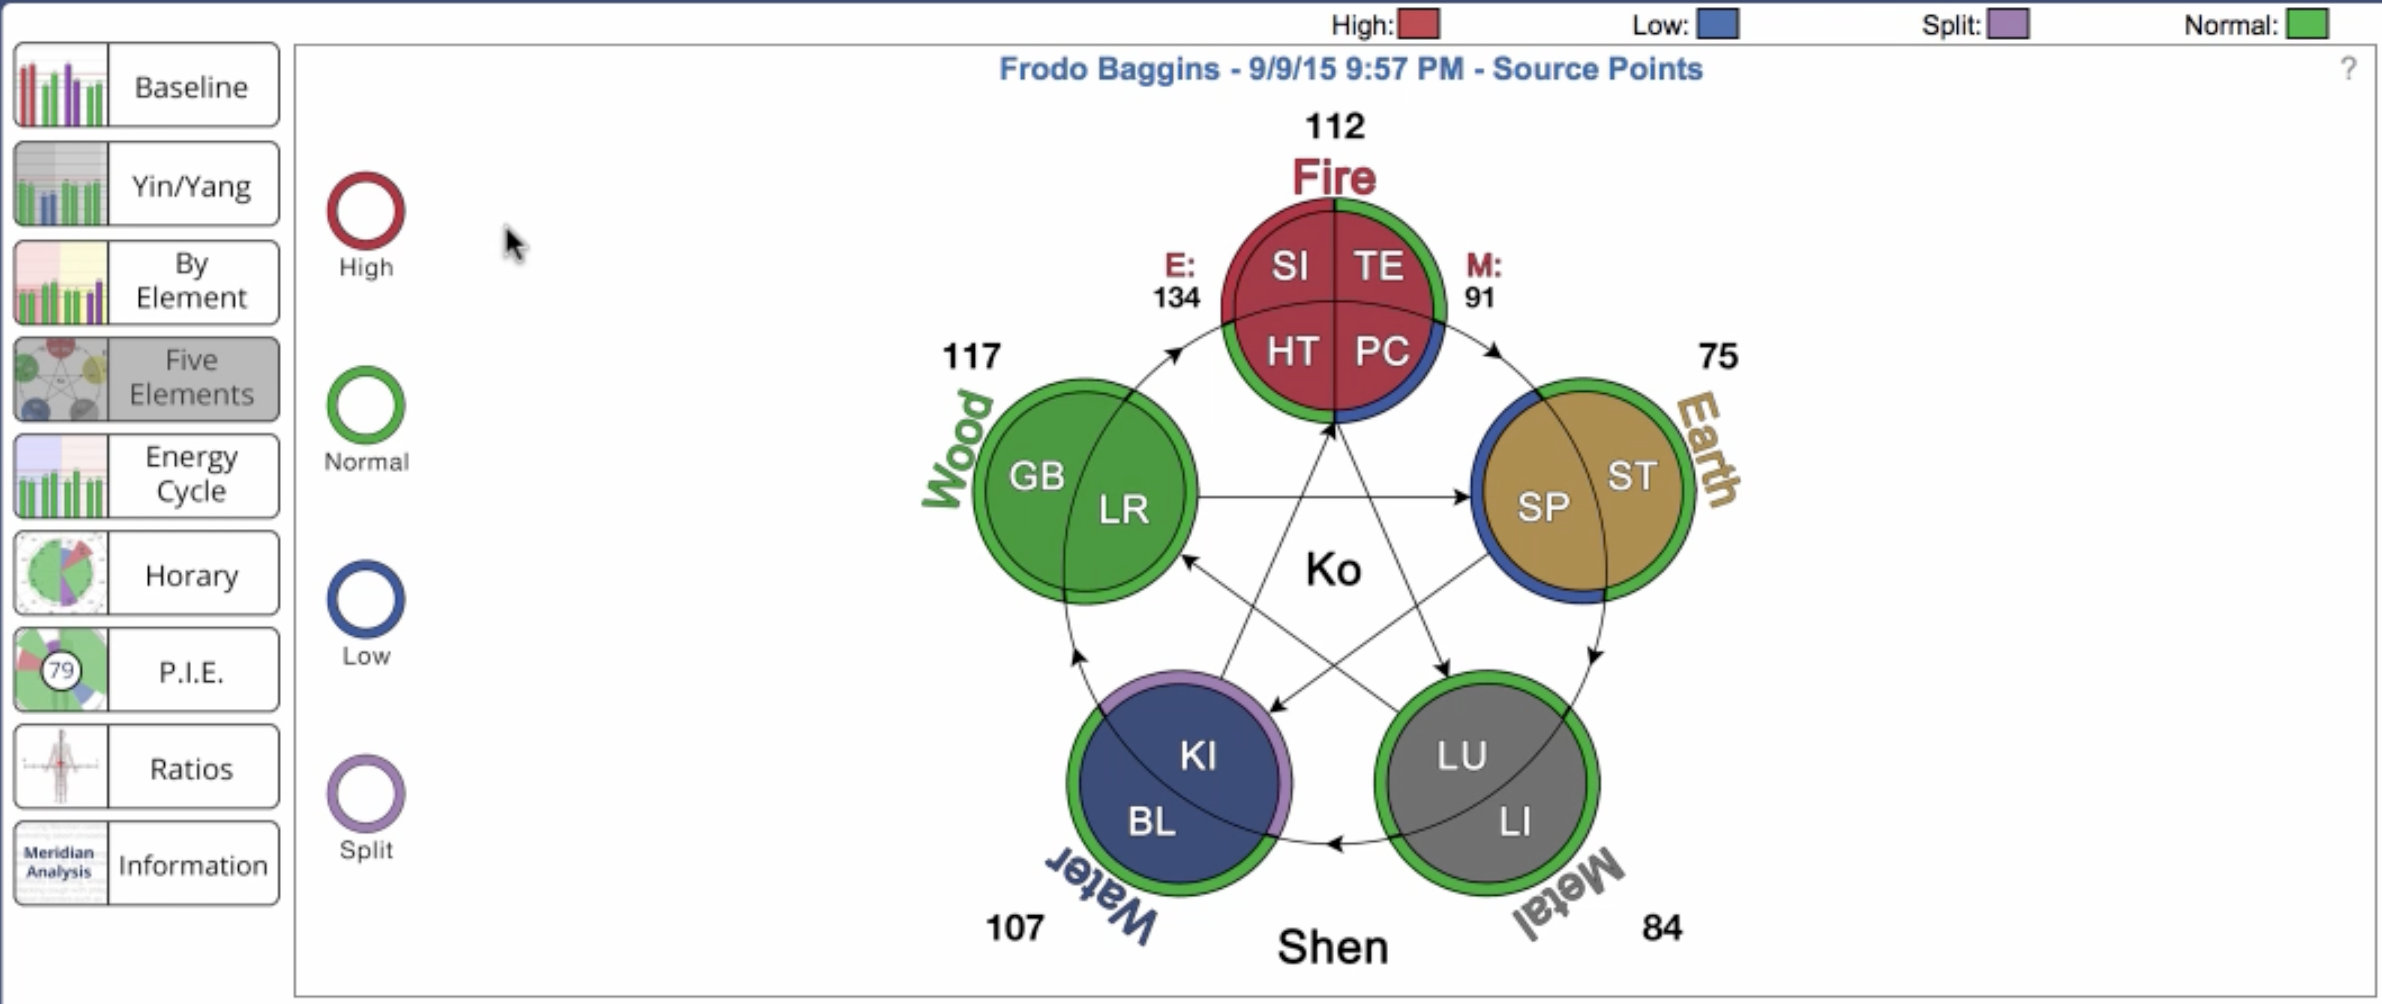
 Perhaps a more simple way to see element balance is to view the Five Elements chart. Here on this chart you have your traditional five elements view with the average for each of the elements showing. The element circles are colored according to the element, but notice the color coding around the outside of each element circles. This coloring highlights what is deficient, excessive, and how you might be able to move the chi from areas of excess into areas of deficiency.
 The next graph is the Energy Cycle graph. This arranges the graph bars based on the time on the horary clock starting at 3:00 AM with Lung and moving across all the channels throughout the day. This is useful to get an idea of how stable things are for your patient throughout the day. This is a particularly effective graph to look at when your patient is suffering from a time-specific issue. Often patients will look at this and say “Yeah, you know that’s my hardest time of the day right in there.”
 You can also do that through a traditional Horary Clock style graph. This goes around the traditional timing starting at midnight and shows you what is excessive, what is split, and the green slices are in the normal range.
 P.I.E score stands for Personal Integrated Energetic score. This was designed with the patient in mind. The PIE score is for the patient to tell how they’re doing. With AcuGraph you can show your patients a lot of graphs, a lot of information, but in the end they likely wont understand or remember much of what you show them. The PIE score boils everything from the graph down to a single number. This single score is an easy way to the patient to track their progress over time. Sometimes the score will go down with initial treatments before it starts to get stable and improve significantly over time. This is caused by the initial reaction of the body to acupuncture treatments and is not something to be concerned about. This is really effective for dialing in your treatments for each patient and getting
The PIE score boils everything from the graph down to a single number. This single score is an easy way to the patient to track their progress over time. Sometimes the score will go down with initial treatments before it starts to get stable and improve significantly over time. This is caused by the initial reaction of the body to acupuncture treatments and is not something to be concerned about. This is really effective for dialing in your treatments for each patient and getting overall improvement over time. It is also the easiest way to communicate results with your patients.
P.I.E score stands for Personal Integrated Energetic score. This was designed with the patient in mind. The PIE score is for the patient to tell how they’re doing. With AcuGraph you can show your patients a lot of graphs, a lot of information, but in the end they likely wont understand or remember much of what you show them. The PIE score boils everything from the graph down to a single number. This single score is an easy way to the patient to track their progress over time. Sometimes the score will go down with initial treatments before it starts to get stable and improve significantly over time. This is caused by the initial reaction of the body to acupuncture treatments and is not something to be concerned about. This is really effective for dialing in your treatments for each patient and getting
The PIE score boils everything from the graph down to a single number. This single score is an easy way to the patient to track their progress over time. Sometimes the score will go down with initial treatments before it starts to get stable and improve significantly over time. This is caused by the initial reaction of the body to acupuncture treatments and is not something to be concerned about. This is really effective for dialing in your treatments for each patient and getting overall improvement over time. It is also the easiest way to communicate results with your patients.
 On the PIE graph, we want everything to be green. The less green and the more red the graph is, then the the more disturbed those channels are.
The last graph is the Ratios graph. This tracks upper (arm) versus lower (leg) balance, as well as left and right balance, overall Chi energy, Yin/Yang balance and Energy Stability. All of these parameters give you opportunity as a practitioner to track how your patience balance is doing and what’s improving.
On the PIE graph, we want everything to be green. The less green and the more red the graph is, then the the more disturbed those channels are.
The last graph is the Ratios graph. This tracks upper (arm) versus lower (leg) balance, as well as left and right balance, overall Chi energy, Yin/Yang balance and Energy Stability. All of these parameters give you opportunity as a practitioner to track how your patience balance is doing and what’s improving.
 Finally, we have a section with Text Information about the exam. This is the Meridian Analysis Information. This talks about each of the imbalances that were found and it lists the findings to meridian by meridian. This is a very valuable report to your patient and they’re going to love reading it and looking at the potential symptoms and saying “Yeah, I have that and that and that. You nailed it. That’s exactly me.” This is a way to solidify the relationship of trust with your patient.

On other thing you need to know…
The Meridian Analysis Information can be customized and edited as much as you want to make the information yours. To customize this, click on Settings on the top menu. Go to Reports and then to Edit Meridian Analysis information where you can edit the text you want to change. Simply choose on the dropdown which Meridian or Imbalance you want to edit, then edit the text and save.

 Once you’ve updated this text, it will show on the Information screen as your default text every time that meridian or imbalance comes up on any patient’s graph. That text will be included in the report both in the printed and the onscreen report.
AcuGraph 5 has incredible reports, graph and patient-specific information that you should be taking full advantage of in your practice!
Once you’ve updated this text, it will show on the Information screen as your default text every time that meridian or imbalance comes up on any patient’s graph. That text will be included in the report both in the printed and the onscreen report.
AcuGraph 5 has incredible reports, graph and patient-specific information that you should be taking full advantage of in your practice!
Love the fact that there are the options for video, lecture and / or both! Thank you… and as always very clear precise and comprehensive!
Great I can change the Meridian Information! So I can translate into Dutch, more easier for my patients!