Editor’s Note: This post references AcuGraph 3, which has been succeeded by AcuGraph CS. The clinical concepts discussed remain applicable to current practice.
Hello Friends,
Some time ago Dr. Jerry Nesseler posed a question:“How can I quickly explain to my patients the pie chart in Acugraph?”
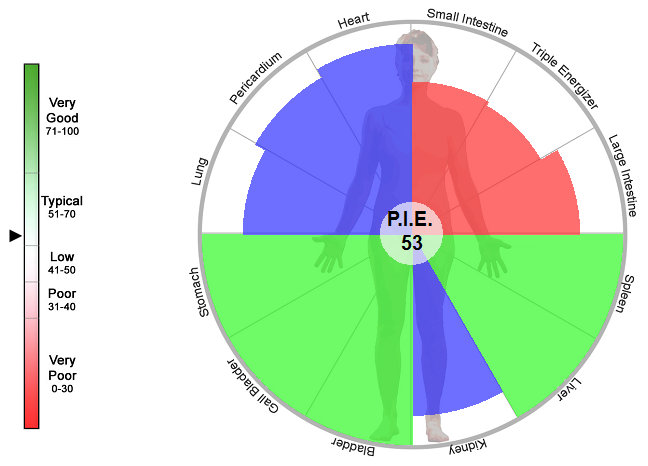
Here’s a bit of background. The chart he’s referring to is our patented P.I.E. (personal integrated energetics) chart first introduced in AcuGraph 3.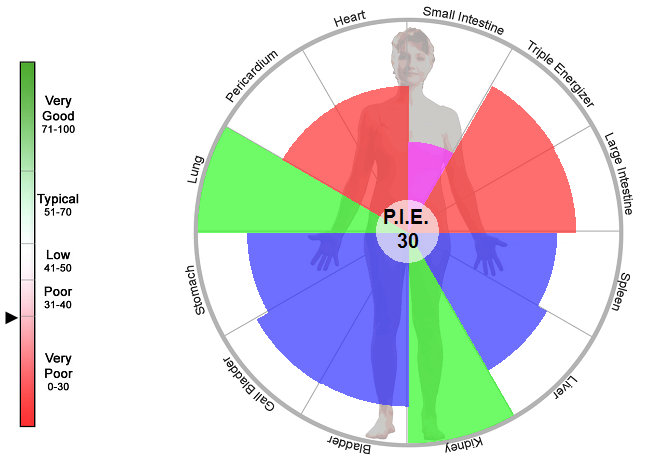 This chart was developed in response to those who requested a fast, easy indicator of patient progress. The advantage of the PIE is that it summarizes the energetic status of the meridians in a single number. So, though a patient may not understand the significance of split meridians, deficiencies, excesses, yin or yang, they can readily understand that their last score was a 30 and the new score of 61 shows improvement.
The other feature of the chart is the color-coded “Pie Slices” representing each meridian. Green is healthy. Non-green is not. The more green, the better. Patients get that.
For the very curious, the non-green pie slices are color coded by the type of imbalance (deficient, excess, split) and sized according to the magnitude of the imbalance. The smaller the slice, the worse the imbalance.
So the point is fast, easy patient communication.
Now, to answer Dr. Nesseler’s question, here’s the language I like to use:
“Mr. Patient, as you can see, your score today is 30. That’s significantly better than 0! As you receive treatment we’ll watch this score climb. This will show you’re making good progress and that we’re on the right track.”
If I’m feeling particularly verbose, I might also add,
“As you can see, 2 of your 12 meridians are testing as normal. The treatments you’ll receive will help restore the proper flow of energy in your body, session by session. Soon you’ll see 4 normal meridians, then 6 or 8! This is exactly the kind of progress we want to see.”
So it’s really that simple. Stick to the numbers–both numbers. The PIE score and the number of normal meridians give the patient something concrete and simple to summarize their progress.
One More Thing
This chart was developed in response to those who requested a fast, easy indicator of patient progress. The advantage of the PIE is that it summarizes the energetic status of the meridians in a single number. So, though a patient may not understand the significance of split meridians, deficiencies, excesses, yin or yang, they can readily understand that their last score was a 30 and the new score of 61 shows improvement.
The other feature of the chart is the color-coded “Pie Slices” representing each meridian. Green is healthy. Non-green is not. The more green, the better. Patients get that.
For the very curious, the non-green pie slices are color coded by the type of imbalance (deficient, excess, split) and sized according to the magnitude of the imbalance. The smaller the slice, the worse the imbalance.
So the point is fast, easy patient communication.
Now, to answer Dr. Nesseler’s question, here’s the language I like to use:
“Mr. Patient, as you can see, your score today is 30. That’s significantly better than 0! As you receive treatment we’ll watch this score climb. This will show you’re making good progress and that we’re on the right track.”
If I’m feeling particularly verbose, I might also add,
“As you can see, 2 of your 12 meridians are testing as normal. The treatments you’ll receive will help restore the proper flow of energy in your body, session by session. Soon you’ll see 4 normal meridians, then 6 or 8! This is exactly the kind of progress we want to see.”
So it’s really that simple. Stick to the numbers–both numbers. The PIE score and the number of normal meridians give the patient something concrete and simple to summarize their progress.
One More Thing
 So how’s that score calculated and what does it really mean? As always, some are content just to drive the car, others want to peek under the hood. So for you hood peekers out there, the score considers a variety of markers including the following:
- Number and severity of splits, excesses and deficiencies
- Yin and yang balance
- Energy stability
- Left/right balance
- Overall Qi level
 emember, the score truly uses the whole range of 0-100. It’s not like grades in school where anything below a 70 is failing. Scores of 20, 30, 40 are common, and scores of 80, 90, 100 are uncommon without treatment. So if your patient scores a 35 on the first visit, don’t worry. That’s exactly what we expect to see.
How do you use the PIE score and chart in your practice?
Do you (and your patients) find it helpful?
And perhaps most importantly, What do you say if the score goes down?
Leave a comment below and let us know YOUR technique!
I look forward to your input!
Thanks!
Dr. Larsen
emember, the score truly uses the whole range of 0-100. It’s not like grades in school where anything below a 70 is failing. Scores of 20, 30, 40 are common, and scores of 80, 90, 100 are uncommon without treatment. So if your patient scores a 35 on the first visit, don’t worry. That’s exactly what we expect to see.
How do you use the PIE score and chart in your practice?
Do you (and your patients) find it helpful?
And perhaps most importantly, What do you say if the score goes down?
Leave a comment below and let us know YOUR technique!
I look forward to your input!
Thanks!
Dr. Larsen
 If you’re thinking about investing in an AcuGraph of your own, you’ll want to look at all of the options below!

One of the reasons that I don’t like to use this pie chart is that it fluctuates up and down so readily. I would love to hear how to explain the drops.
Usually with the regular chart and patient input it is clear what caused the imbalances. But that number is hard to explain I think.
This is not directly related to PIE, which I love. I also love to show the Ratios chart to patients and talk about goals for where we want their energy to be as far as stability, centered on the cross-hairs etc. My question to you what is going on with splits? Some have suggested that they are more significant than too low or too high. Do you agree and what do you tell your patients?
I agree that true splits are very significant and must be addressed, because they indicate a meridian is not communicating between the two sides, and therefore one or both sides will be malfunctioning, and unable to properly do their job. The split can then lead to other imbalances in the other meridians.
I say “true split” because it’s easy to get false split readings based on point location being slightly different between the two sides. This is why AcuGraph offers you the opportunity to remeasure the low side of each split to verify point location. I find that approximately 80% of splits resolve when remeasured. The ones that don’t resolve are “true splits.”
Hi dr larsen, I have been using acugraph for over 6 months and I have found it very good. But I have found the PIE score unreliable. If someone’s energy is very very low the graph automatically scores them normal and therefore a high PIE score. Likewise if all the readings are very high – 200 it gets a perfect score. In clinic I have found these scores to be inaccurate.
Have you found this and do you agree?
It’s important to remember what the PIE score is actually showing. It reflects the BALANCE of the chi, not the AMOUNT of chi. Therefore, if someone is very low in amount of chi, but fairly well balanced, the PIE score will still be good because the balance is good. The same applies to very high readings. A patient can be high and balanced (good PIE) or high and imbalanced (poor PIE.)
We set it up like this intentionally, as the overall average chi reading is the least likely to change with treatment. It most strongly reflects the patient’s skin type and overall conductivity. Therefore the actual chi level is much less important than the balance between the meridians.
When properly understood to reflect balance, I’ve found the PIE score highly useful for the vast majority of patients.
The fluctuation of the PIE reflects the fluctuation in the patient’s energy balance from day to day. We all have good days and bad days.
As for explaining drops, I think this is a great idea for a future blog post. In general, I explain drops by noting how fortunate it is that we’re monitoring so closely. This allows us to adjust our treatment technique as needed to compensate for the changes in the energy system.
Watch for a blog post on this topic.